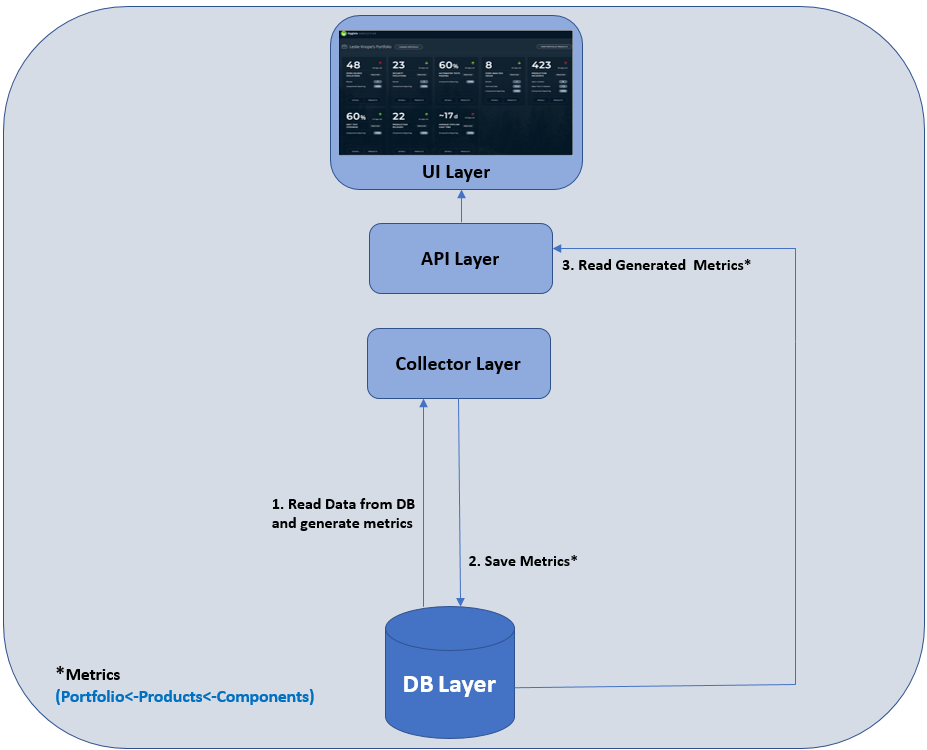
The following diagram provides a high-level view of Hygieia Executive:
Each layer in the architecture is explained as follows (starting from the Database Layer):
| Components | Description |
|---|---|
| Database Layer | The database layer, which is used for storage and retrieval of data, consists of the Read and Write Databases. Each collector, based on the Metric Type, reads data from the Read Database, generates metrics, and writes the metrics into the Write Database. |
| Collectors’ Layer | The Collectors’ Layer consists of the Portfolio and Metrics’ Collectors. A collector pulls the raw data from the Read Database, and then runs an aggregation logic to generate Metrics. Metrics contain Time Series and Summary. The Time Series denotes the events that occur over the last 90 days, and Summary is an aggregation of those 90 days. These Metrics are generated for each Portfolio at the Component Level and then rolled-up into the Product Level (Portfolio <- Product(s) <-Component(s)) |
| API Layer | The API Layer provides an interface to display the Metrics on the UI. |
| UI Layer | The UI layer (User Interface) is Hygieia Executive’s front-end and contains all the Graphical User Interface (GUI) elements for users to view. It is here where users are also able to view the dashboard. The UI Layer pulls the data using the API mainly based on the Name, Line of Business, Product Name, Metric Type, and Product Name (where necessary) and projects it on the UI. |