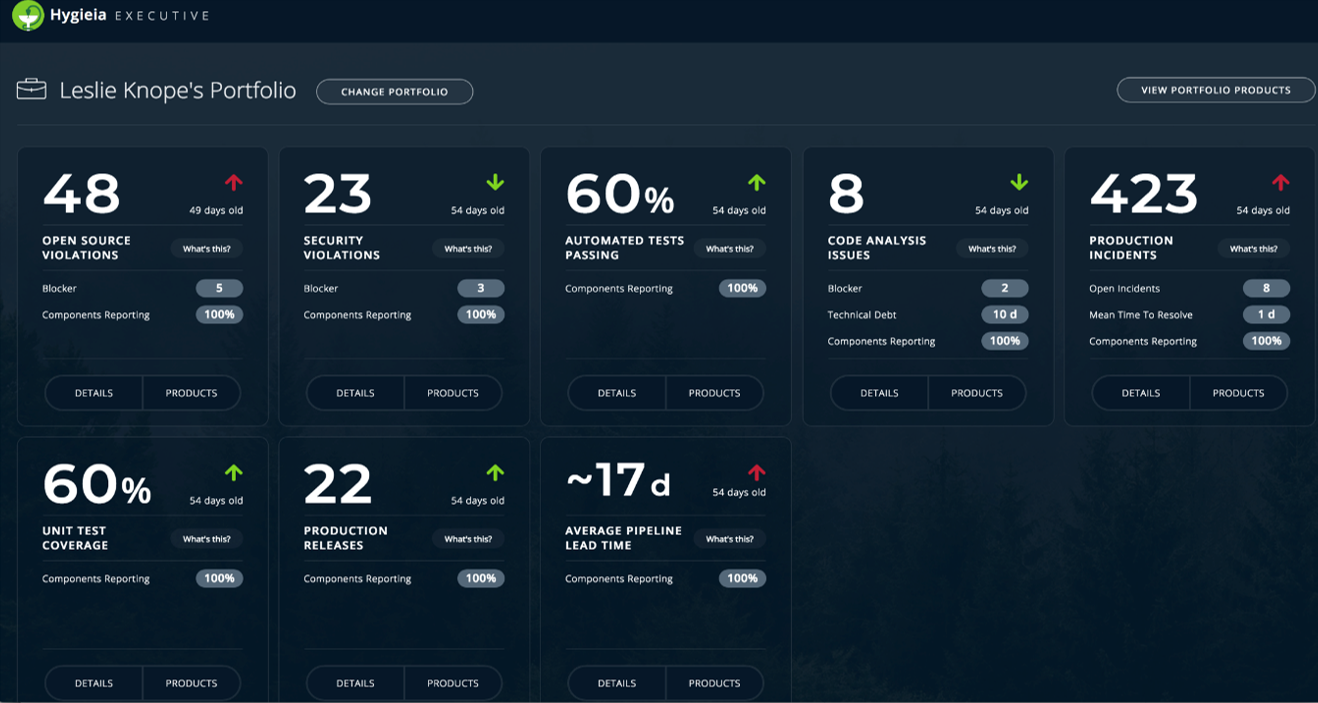
The Portfolio screen provides a high-level view of metrics that are collected by Hygieia and displayed on this screen.
The Portfolio details the state of all products by considering the portfolio-product-component combination. For example, as a portfolio owner, you will be able to see the amount of test coverage there is for your portfolio, or the production incidents that exist for all your products.
Each widget on the screen provides metrics for various events that help analyze the trends over time. An event is anything that a metric represents, such as a production incident or an open source violation.
Each of the widgets on the dashboard is explained in the Widgets section.
View Portfolio Products to view the metrics for all the products under a selected portfolio.
Change Portfolio to select a different executive from the list of portfolios.
Information on a Widget
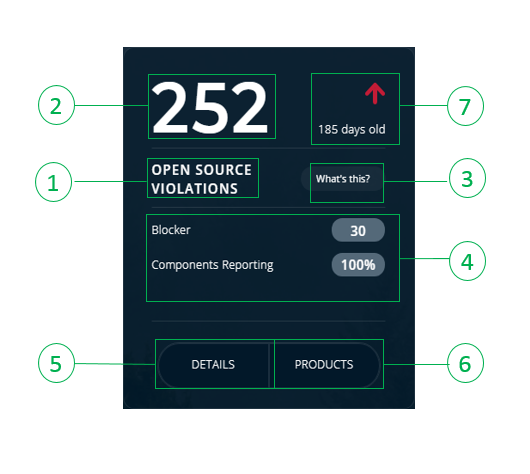
| Widget Information | Description |
|---|---|
| 1. Metric Name | A measure of the state of your portfolio. |
| 2. Metric Value | This value is a measure of the metric based on the data from all products in your portfolio. |
| 3. What’s This? | Click on this box to view a brief definition of the metric itself. In this example, Open Source Violations is defined. |
| 4. Metric Breakdown | Different components (such as Blocker, Components Reporting, etc.) that comprise the metric value at the portfolio level. |
| 5. Details | Click on this button to see the Portfolio metrics screen, which describes the breakdown of the aggregated value for a metric by considering all products in a portfolio. |
| 6. Products | Click on this button to view the Products screen, which explains the products in any given portfolio. |
| 7. Trend Indicator for a timestamp | Green or red arrows indicate the positive or negative change in trends to that metric over a 90-day period. The direction of the arrows shows an increase or decrease in the occurrence of an event (such as a violation or an incident). However, if there is a blank status, that means that there is no data available to arrive at a trend indicator value |
The Trend Indicator
The following are examples to explain the trend indicator:
 Red Arrow (Upwards) - A negative increase in the number of open source violations or production incidents over the last 90 days
 Green Arrow (Upwards) - A positive increase in the percentage of automated tests that passed the latest code execution
 Red Arrow (Downwards) - Negative decrease in the number of production releases for associated product components
 Green Arrow (Downwards) - The positive decrease in code-related issues across all products in your portfolio
 No Status - No data update from the latest collector run.
The Metric Breakdown
The Metric Breakdown terms are defined as follows:
| Term | Definition |
|---|---|
| Blocker | The number of components having events marked with the severity level as a blocker. |
| Components Reporting | The percentage of components from which data is being successfully collected for calculating the metric. |
| Technical Debt | The effort to fix all maintainability issues. The measure is stored in minutes in the database. An 8-hour day is assumed when values are shown in days. |
| Open Incidents | The total number of production incidents with Open status |
| Mean Time to Resolve | The average elapsed time from when an incident is reported until it is resolved |
Widgets on the Dashboard
This section provides specifics about the different metrics on the dashboard. The way these widgets track data has a related pattern, thus some of the definitions below are similar.
Code Commits
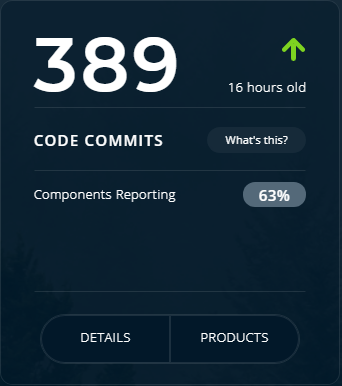
The Code Commits widget displays the number of commits occurring over the last 90 days for all the products and the associated components in a portfolio. This widget also displays the percentage of Components Reporting from which the data is being collected for calculating this metric. In this example, 63% components are reporting data.
For more information on the values and calculations on the metrics, see the Metrics Details section.
Open Source Violations
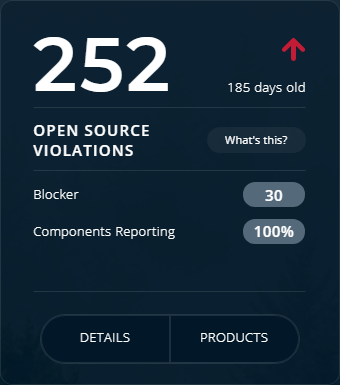
The sum of known, unresolved open source violations for all associated components, including violations with blocker, critical, and major severity. An infraction occurs when usage violates legal and security compliance of an open source software license.
This widget breaks down the open source violations in to the following components:
- Blocker
- Components Reporting
Security Violations
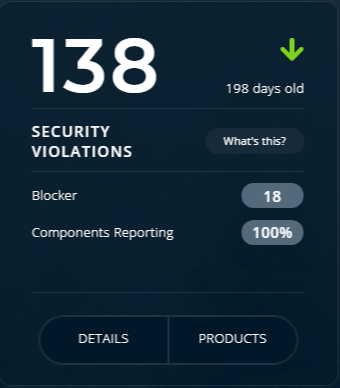
Much like Open Source Violations, Security Violations are the sum of known, unresolved issues for all associated components. This includes infractions with blocker, critical, and major severity. Security violations are collected by Hygieia from various software security scanning tools.
This widget breaks down the security violations in to the following components:
- Blocker
- Components Reporting
Automated Tests Passing
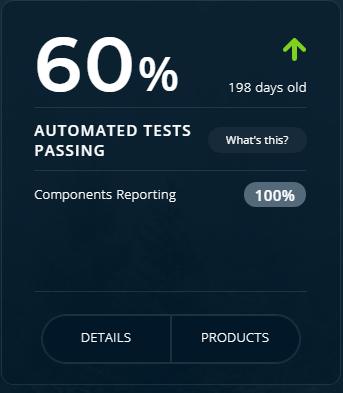
The percentage of automated acceptance tests that passed during the most recent test execution for each associated component collecting test automation results in Hygieia. The formula is as follows:
Count of passed automated tests / Count of [Passed + Failed + Skipped] Automated tests.
In addition, this widget displays the percentage of Components Reporting from which the data is being collected for calculating this metric.
Code Analysis Issues
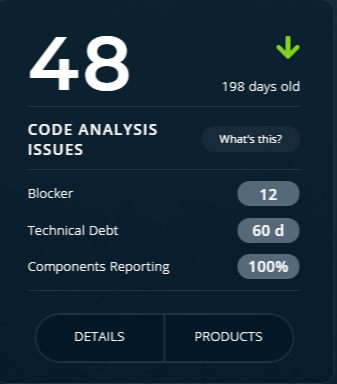
The sum of known, unresolved code issues for all associated components. This includes violations with blocker, critical, and major severity. Hygieia collects this information from various software quality scanning tools. Estimated days of technical debt effort is also included. Issues are collected by Hygieia from various software quality scanning tools.
This widget breaks down the code analysis issues in to the following components:
- Blocker
- Technical Debt
- Components Reporting
Production Incidents
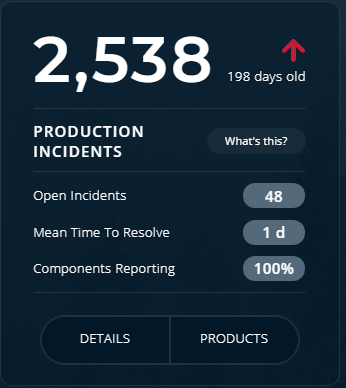
The sum of severity 1, 2, 3, 3C, and 3D production incidents occurring over the last 90 days. An incident is any event that is not part of the standard operation of a service and that causes or may cause an interruption to, or a reduction in, the quality of that service. Severity is a measure of the impact on the number of employees or groups in an organization. A product incident with severity 1 has the maximum impact on users.
This widget breaks down the production incidents in to the following components:
- Open Incidents
- Mean Time to Resolve
- Components Reporting
Unit Test Coverage
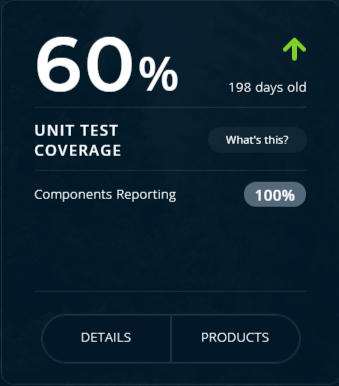
The percentage of code covered by unit tests for all associated components. Unit tests are automated low-level tests that focus on a small unit of software. They are developer implemented and aim to reduce regression issues as enhancements and refactoring occur.
In addition, this widget displays the percentage of Components Reporting from which the data is being collected for calculating this metric.
Production Releases
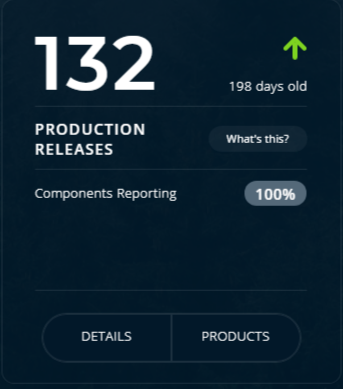
The number of production releases occurring over the last 90 days for all associated components. Production release information is collected by Hygieia from release management software to deployment tools.
This widget also displays the percentage of Components Reporting from which the data is being collected for calculating this metric.
Average Pipeline Lead Time
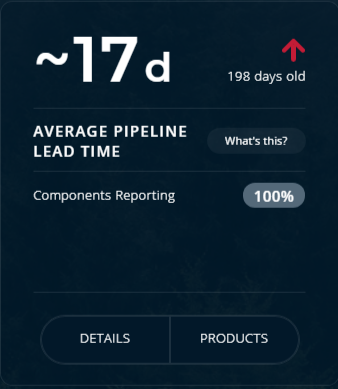
Average amount of time from code commit to production deployment for all associated components. Cycle time is a key indicator of overall DevOps efficiency and is collected by Hygieia from continuous integration to delivery tools.
This widget displays the percentage of Components from which the data is being collected for calculating this metric.