A component is a unit of software that is part of the larger product or application. This screen lists all the components under one product in a portfolio and gives a breakdown for the metric values. To view this screen, click Details on a widget in the Product details screen.
Additional information about each metric is represented as charts or graphs on the screen, and describes the following elements:
-
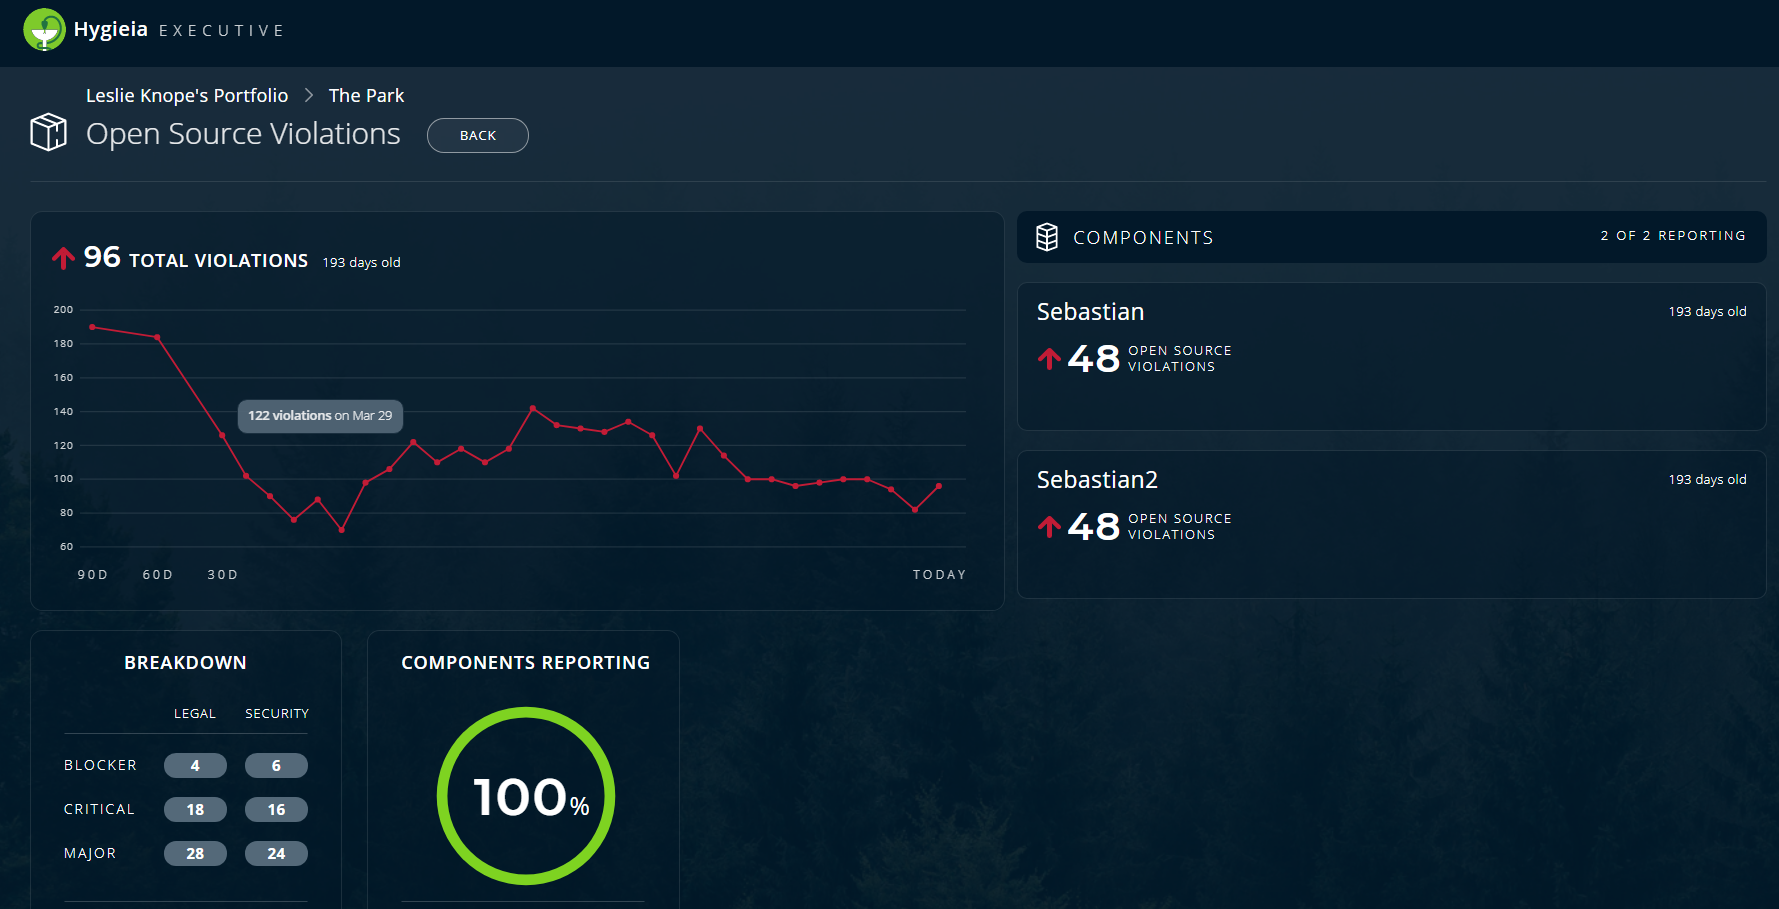
A graphical representation of the number of occurrences of an event (such as a violation or an incident) versus time intervals (starting from the current day and going back 90 days). The dots on the graph provide the number of events for a component on a particular day (in this case, there were 122 violations on March 29th). In addition, the percentage of Components Reporting data is displayed in a percentage wheel. The color coding is explained as follows:
Color Code Percentage range of Components Reporting Red 0 to 25% Yellow 26 to 49% Green 50 to 100% - The event Breakdown with block, critical, or major severity level for all components in a product
- List of all Components for a product in the portfolio
Once you have finished viewing the component level details, click Back to return to the Portfolio screen.