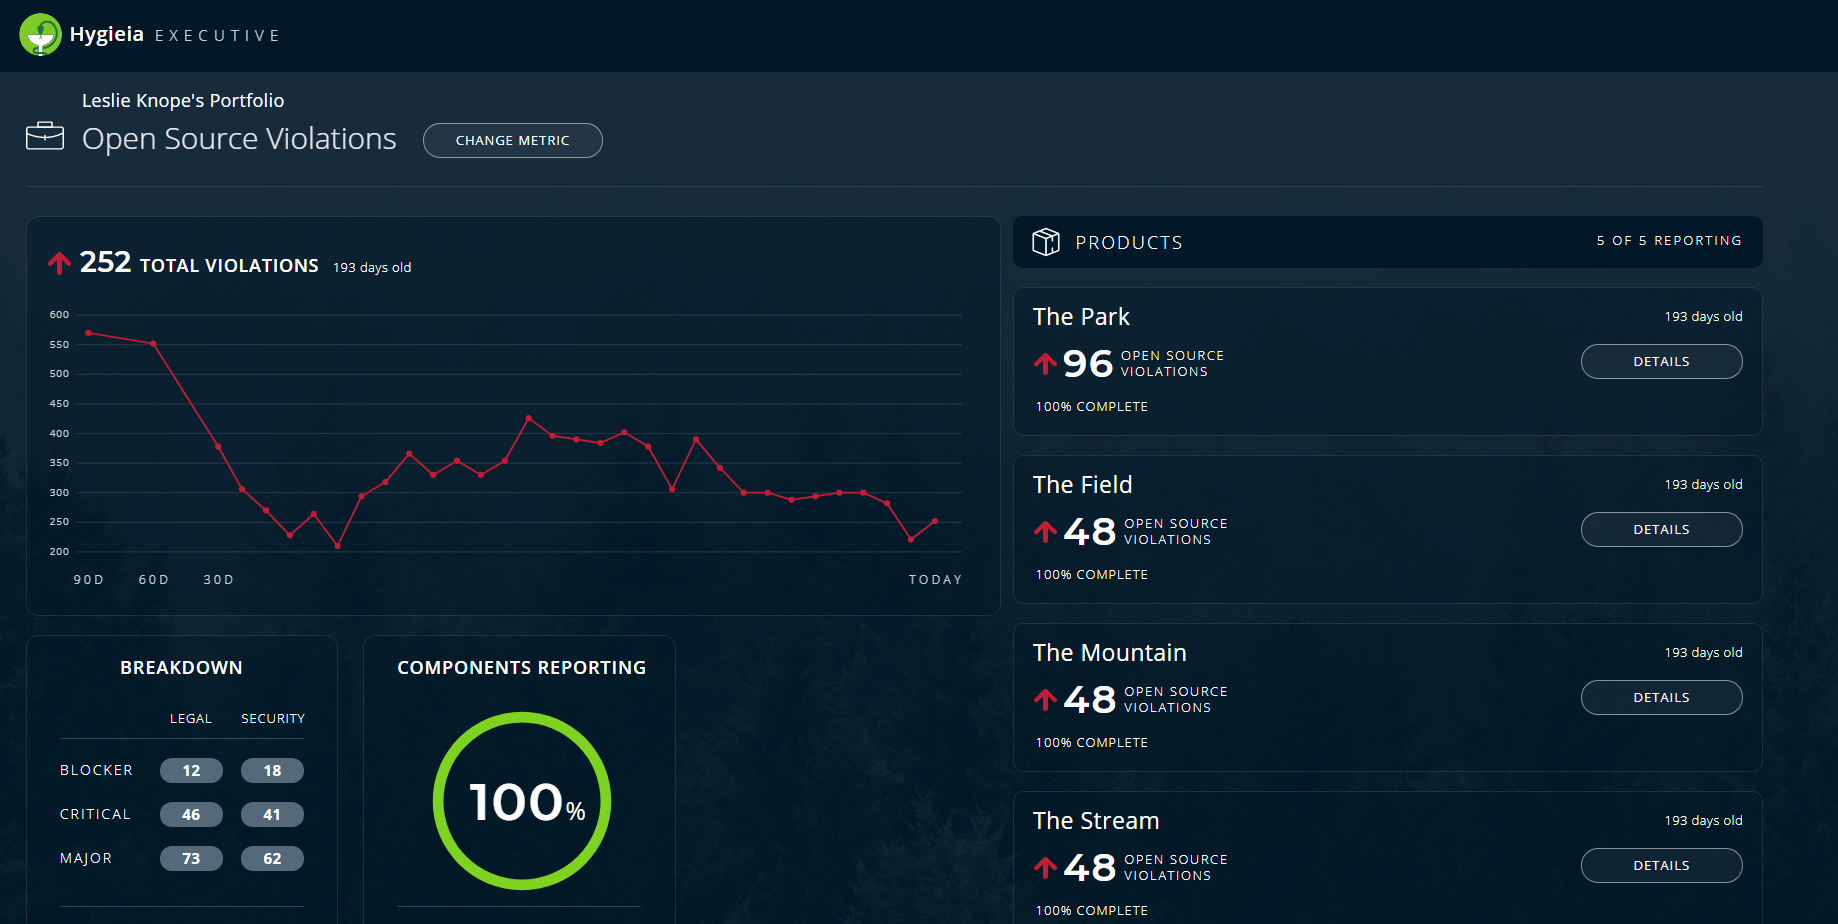
This screen gives a visual representation, such as a graph or percentage wheel, of the aggregated metric value. In addition, you can view a list of all the all products in a portfolio. To view this screen, click Details on a widget in the Portfolio details screen.
Additional information about each metric that is represented as charts or graphs on the screen, is described as follows:
-
A graphical representation the total number of occurrences of an event (such as a violation or an incident) versus time duration (from the current day and going back 90 days). The dots on the graph provide the number of events for a product on a particular day.
-
The values of different components (such as Breakdown, Components Reporting, Technical Debt, etc.) that comprise the metric value at the portfolio level are displayed here. In the screenshot above, the Breakdown for the Open Source Violations is displayed with the number of legal and security issues for each severity level (blocker, critical, and major). In addition, the percentage of Components Reporting data is displayed in percentage wheel.The color coding is explained as follows:
Color Code Percentage range of Components Reporting Red 0 to 25% Yellow 26 to 49% Green 50 to 100% -
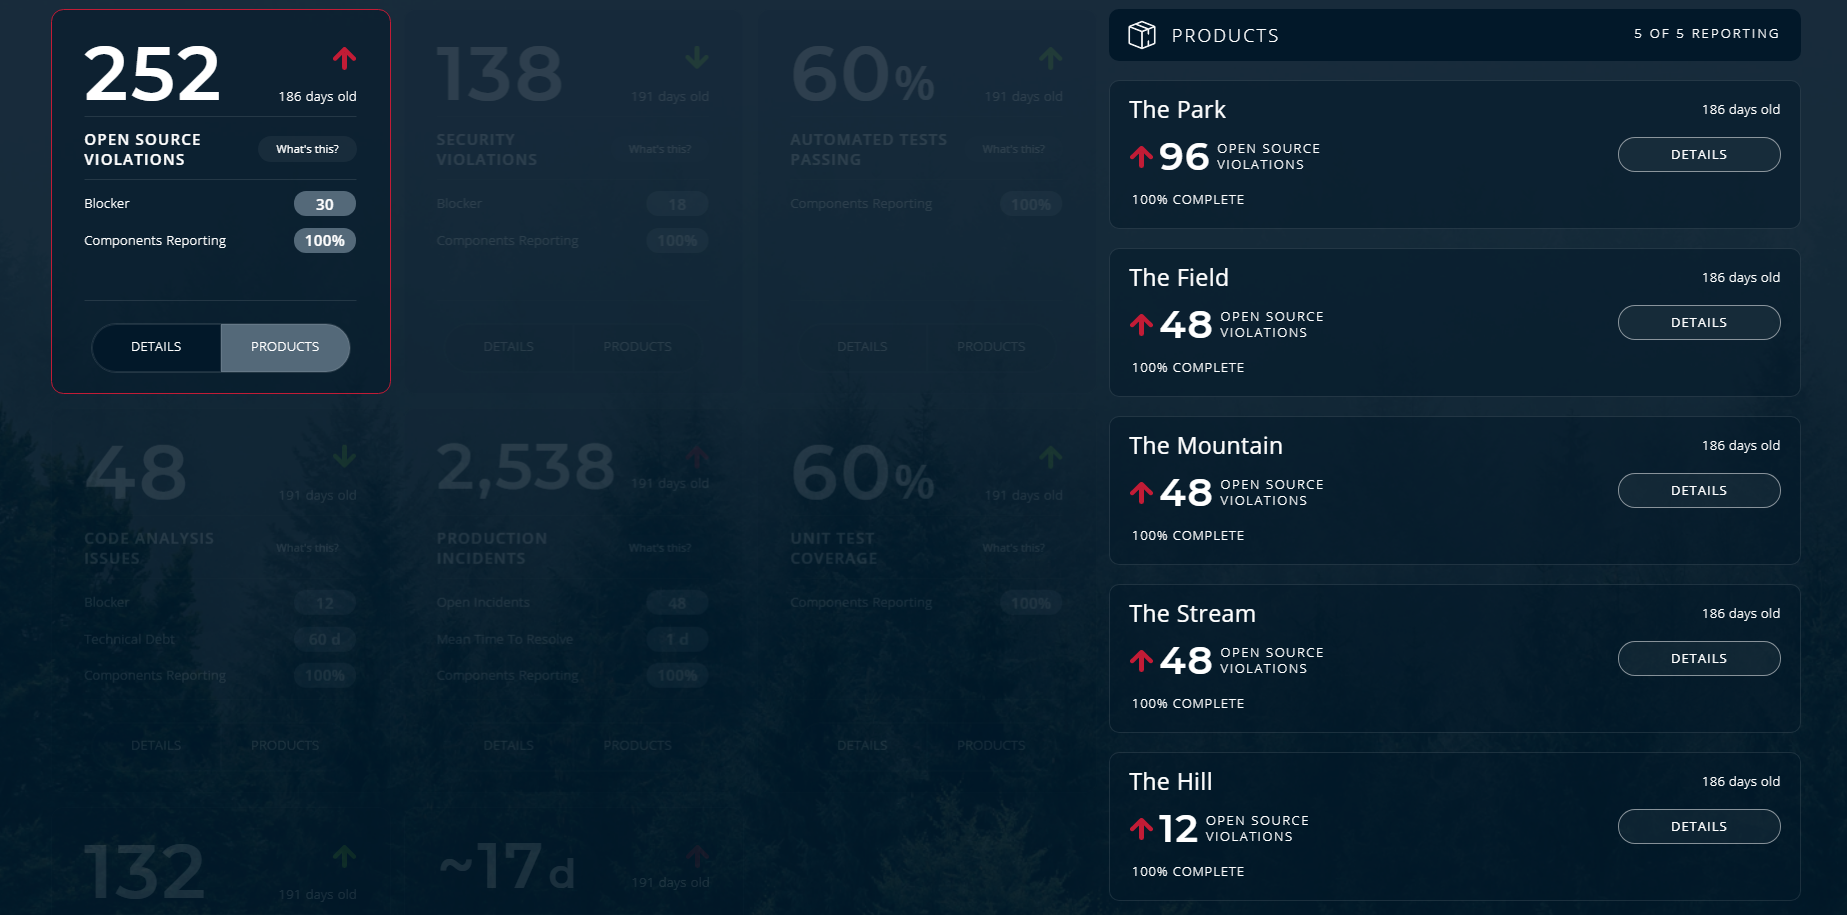
List of all Products in the portfolio along with the trend indicator for the metric.
Click Details to view the Components screen with the component level details for each product.
Click Change Metric to view these details for another metric. This navigates you back to the Portfolio screen.
Product Details
All applications that are managed by an executive are displayed as a list of products under a portfolio. On the Products screen, you can view the all products that are part of an executive’s portfolio. To view this screen, click Products on a widget in the Portfolio details screen. In the following screenshot, the Products screen displays all products that fall under the executive, Leslie Knope.
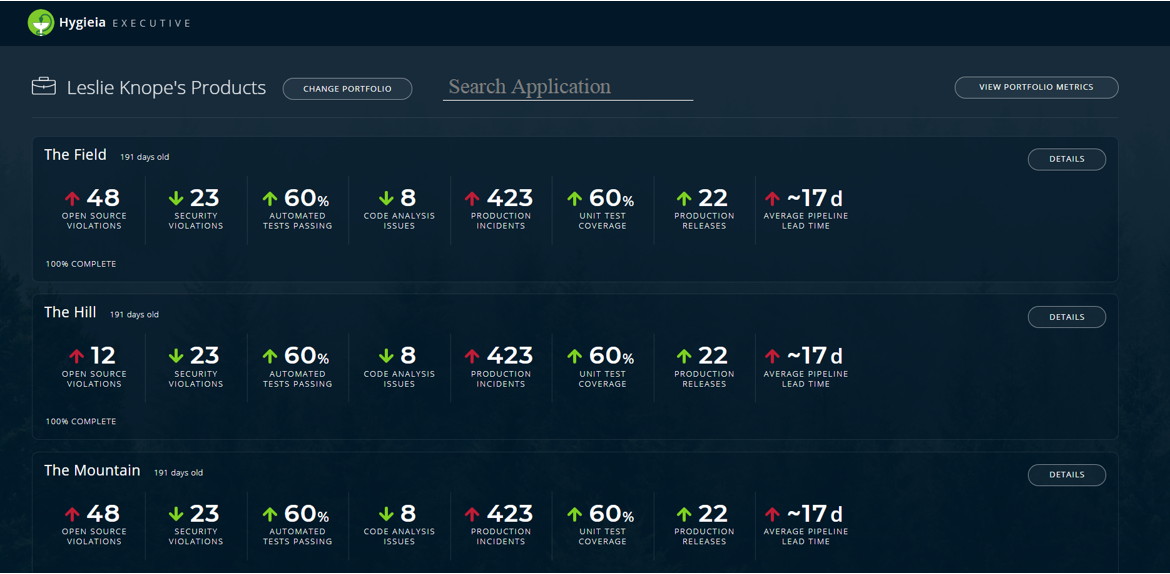
On this screen, you can view the following details:
- List of all the products under the portfolio
- The metric values for each product with the trend indicator (green and red arrows)
- Percentage of components reporting data for calculating the metrics of each product
Click Details to view the list of components for each product and their corresponding metrics. This takes you to the Components screen.
Click Change Portfolio to view another executive’s portfolio from the Select a Portfolio screen.
The following screen is another view of the Products screen, which allows you to view the metric and the corresponding metric breakdown across all products in the portfolio. To view this screen, click on Products on each widget in the Portfolio screen.