The widget view enables you to configure widgets with various DevOps tools that are used to manage your CI/CD pipeline. The widgets are highly flexible, meaning you can choose to configure the necessary widgets to view your DevOps pipeline on the Hygieia dashboard. These widgets are integrated with Collectors to showcase information, collected from the CI/CD tools, on the Hygieia dashboard.
Standard Dashboard Widgets
This section gives a high-level overview of the standard dashboard widgets available in a team dashboard.
| Widget | Description | Supported Collectors |
|---|---|---|
| Features | The Features widget displays Epics or Issues in the current sprint to help you track epics or issues based upon a sprint type using the feature management tools. | Jira, VersionOne, GitLab Feature |
| Code Repo | The Code Repo widget displays graphical representations and summary of the code contribution activities from one of the supported code repositories. The code contribution activities include commits to the repository, number of issues raised, number of pull requests submitted per day, and the current coding trend. | GitHub, Subversion, Bitbucket, GitLab |
| Build | The Build widget shows the build status – which is either a success or a failure – and the average duration of time of the builds over the course of the last 14 days. | Jenkins, Bamboo |
| Quality | The Quality widget displays the code quality details based on unit and functional test results in a tabular format. Each tab displays static code analysis, detection of security issues, license and security issues, and functional test results in Open Source projects. | Sonar, Fortify, Nexus IQ |
| Performance | The Performance widget displays the performance matrix of the application. That means, this widget tracks the overall health of business transactions, node health, as well as the health of HTTP traffic in the application. | AppDynamics |
| Deploy | The Deploy widget displays deployment and environment status details, including information about artifacts and server(s). | UDeploy, XLDeploy |
| Monitor | The Monitor widget displays the monitor details that track the status of services such as APIs, GitHub URLs, or Jenkins. This widget displays the status based on the service HTTP code. | Any URL |
| ChatOps | The ChatOps widget displays the collaborative details from the chat engine. | HipChat |
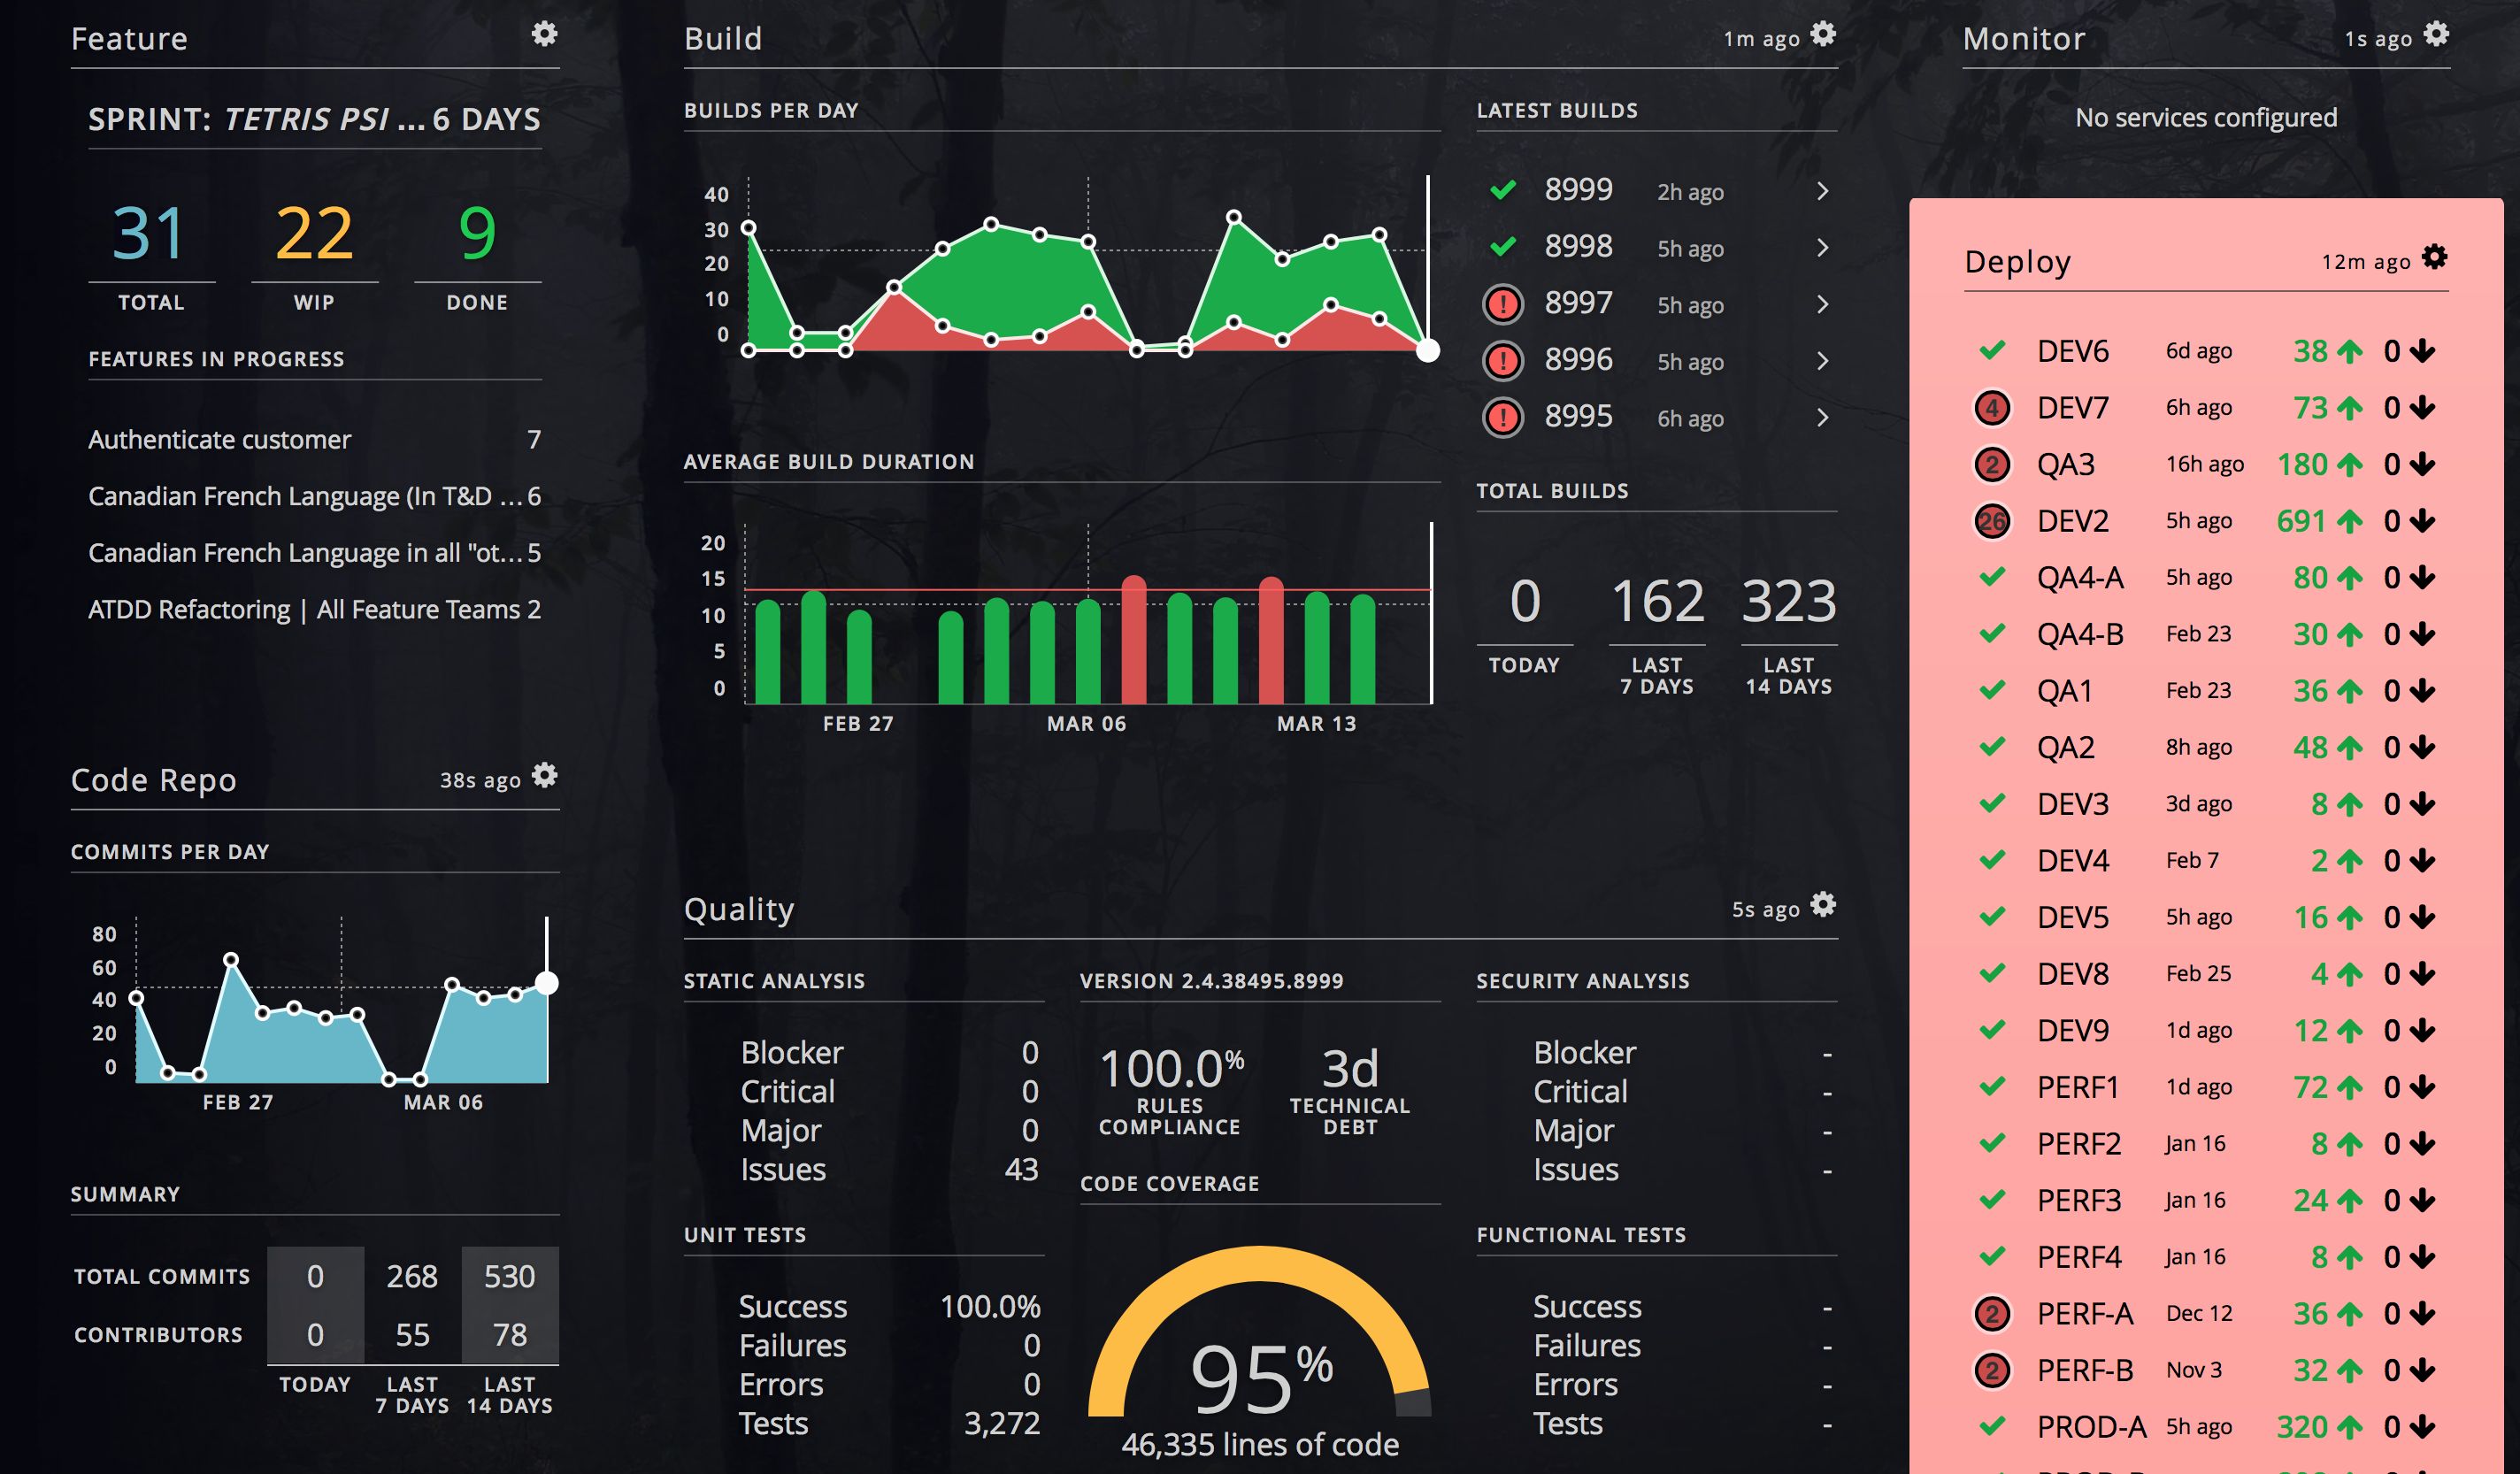
As the following screenshot shows, the widget view enables you to configure and visualize the data of your DevOps pipeline:
Configure Widgets - Common Procedure
To configure a widget in the dashboard:
-
Click Configure Widget under the widget name for which you want to configure your DevOps Dashboard.
The Configure [Widget Name] Widget dialog box is invoked.
-
In the Configure [Widget Name] Widget screen, enter configuration values for the fields, and then click Save.
The Dashboard widget displays values based on your configuration.
To change widget settings:
-
Click the Settings icon, make any configuration changes, and then click Save.
The widget displays details based on the new configuration.
To clear a configured widget:
- Click the Delete icon beside the template name. System prompts a message to confirm or cancel deletion. Click Delete to confirm deletion. The widget configuration is cleared.
The Feature Widget
How to Configure the Widget?
- Click Configure widget to invoke the Configure Feature Widget screen. In this screen, enter the following details:
- Agile Content Tool Type - Select one of the following feature data source:
- JIRA
- VersionOne
- Gitlab Feature
- Project Name - Enter a new project name or select one of the existing projects from the list of projects.
- Team Name - Enter a team name
- Estimate Metrics are:
- Hours
- Issue Count
- Story Points
- Sprint Type - Select a sprint type:
- Sprint
- Kanban
- Both
- List Feature Type - Select a feature type:
- Epics
- Issues
- Agile Content Tool Type - Select one of the following feature data source:
- Click Save to save and view the Feature-related details in the widget.
What Information is Displayed on the Widget?
For a configured sprint type and the number of days remaining for that sprint type, this widget displays the following information:
- Total number of features in a sprint type
- Total number of features that are in progress
- Total number of features that have been completed for a sprint
- The list of features or epics that are moving forward with their corresponding number of issues either in backlog or in progress
The Code Repo Widget
How to Configure the Widget?
- Click Configure widget to invoke the Configure Repo Widget screen. In this screen, enter the following details:
- Select the Repo Type from the dropdown list:
- GitHub
- Subversion
- Bitbucket
- Gitlab
- Enter the Repo URL for the selected Repo Type
- Enter the Branch for the repo. The repo branch is not applicable for Subversion.
- Enter the repo login Credentials. This is not applicable for Gitlab.
- Enter the API Key for a private Gitlab repo.
- Enter the Personal Access Token for a GitHub repo. For details on generating a Personal Access Token for GitHub, see the GitHub documentation.
- Select the Repo Type from the dropdown list:
- Click Save. The Code Repo widget is configured for the selected repo.
What Information is Displayed on the Widget?
This widget displays code contribution data as follows:
- A graphical representation of the number of issues, pulls, and commits per day versus time intervals (i.e., starting with the current day and going back the previous 14 days)
- A summary of all the commits, pulls, and issues. This area also shows how many commitors, contributors, and ideators are involved. Moreover, for all six of these categories they align with the days last worked on, beginning with today and going back the previous 14 days.
The Build Widget
How to Configure the Widget?
The Jenkins collector displays build-related details in the build widget. To configure the build widget:
- Click Configure widget to invoke the Configure Build Widget screen. In this screen, enter the following details:
- Enter the Build Job
- Enter the Build Duration Threshold (in minutes). The default duration is 3 minutes.
- Alert Takeover Criteria indicates the number of consecutive build fails. The default number is 5.
- Click Save. The Build Widget is configured for the selected repo.
What Information is Displayed on the Widget?
This widget displays the following build information, beginning with the current day and going back the previous 14 days:
- A graphical representation of the number of builds per day
- A summary of the total number of builds for the application
- A graphical depiction of the average build duration
The Quality and Performance Widget
How to Configure the Widget?
Code quality related details for functional and unit tests are displayed in this widget based on your configuration of Sonar, Fortify, or Nexus IQ collectors. To configure the quality widget on the dashboard:
-
Click Configure widget to invoke the Configure Code Analysis Widget screen. In this screen, enter the following details:
- Static Code Analysis
- Security Scan
- Open Source Scan
- Functional Tests
- To configure functional tests:
- Click the add button, enter a name for the test, and then select a functional test from the drop-down list.
- Click Save. The code quality widget is configured for the selected code analysis job.
What Information is Displayed on the Widget?
The quality widget displays code quality details in the following tabs:
- Static code analysis - This tab displays code analysis based on unit and functional test results.
- Security – This tab displays the security vulnerabilities in the code after performing a code scan.
- Open Source - This tab displays open source scan details such as security violations and adherence to open source licenses.
- Tests – This tab displays the Cucumber test reports in JSON format, configured in the Build tool.
Click VIEW ALL to view the code quality analysis details in your configured code quality tool.
The AppDynamics collector displays performance-related details in this widget. To configure the Performance widget:
- In the Performance tab, click Configure widget to invoke the Configure Performance Widget screen. In this screen, enter the following details:
- Select a Performance Analysis Job from the drop-down and then click Save.
The performance widget displays the performance matrix of the application. That means, this widget tracks the overall health of business transactions, node health, and the health of HTTP traffic in the application. This includes the overall business transaction health, node health, and HTTP traffic being tracked for the application.
The Deploy Widget
How to Configure the Widget?
Code deployment details are displayed in this widget based on your configuration of UDeploy, XLDeploy, or Jenkins collectors. To configure the deploy widget on the dashboard:
-
In the Performance tab, click Configure widget to invoke the Configure Deploy Widget screen. In this screen, enter the following details:
- Select the deployment application.
- Enter the criteria to ignore the environment failures pattern.
- Check the ‘Aggregate servers’ box to avoid server duplication.
-
Click Save.
What Information is Displayed on the Widget?
Hygieia displays the following details in the Deploy widget:
- Application deployment date
- List of all environments deployed for the application
- Last updated date for each environment
- Number of servers up or down in each environment
Click an application environment to view additional artifact details from your application deployment tool, including:
- Last updated date of the selected application environment
- Deployment date for the artifact
- Version Number of the artifact
- Server name
- server status (up or down)
Click View in [deployment tool name] to view the application environment details in the deployment tool.
The Monitor Widget
How to Configure the Widget?
- Click Configure widget to invoke the Monitor Configuration screen. In this screen, enter the following details:
- In Our Services section, enter the service name to appear on the widget.
- Enter the service URL you want to monitor on the dashboard. Click the add button to add additional services.
- In the Dependent Services section, select any dependent service that you want to monitor from the dropdown list. Click the add button to add any additional services.
- Click Save.
What Information is Displayed on the Widget?
The monitor widget displays a list of services with the service status. Click ICON LEGEND to view the icon description and the corresponding HTTP code. Click on each service listed in the widget to add or modify the service status.
The ChatOps Widget
How to Configure the Widget?
- Click Configure widget to invoke the Configure ChatOps Widget screen. In this screen, enter the following details:
- Select HipChat as the chat engine from the drop-down list.
- Enter the URL to the ChatOps Server.
- Enter Room Name and Room Auth Token to connect to the chat engine.
- Click Save.
What Information is Displayed on the Widget?
This widget displays collaborative details from the chat engine.