Cloud Utilization is always a major concern for DevOps, so the DevOps Hygieia Dashboard offers a high-level view of that, too.
Configure the Cloud View
To configure the Cloud view:
- In the Cloud tab of your Team Dashboard, click Configure widget.
- In the Configure Cloud Widget pop-up window, enter the following details:
- Account Number
- Tag Name, to view details specific instance details for
- Tag Value
- Click Save.
Detail View
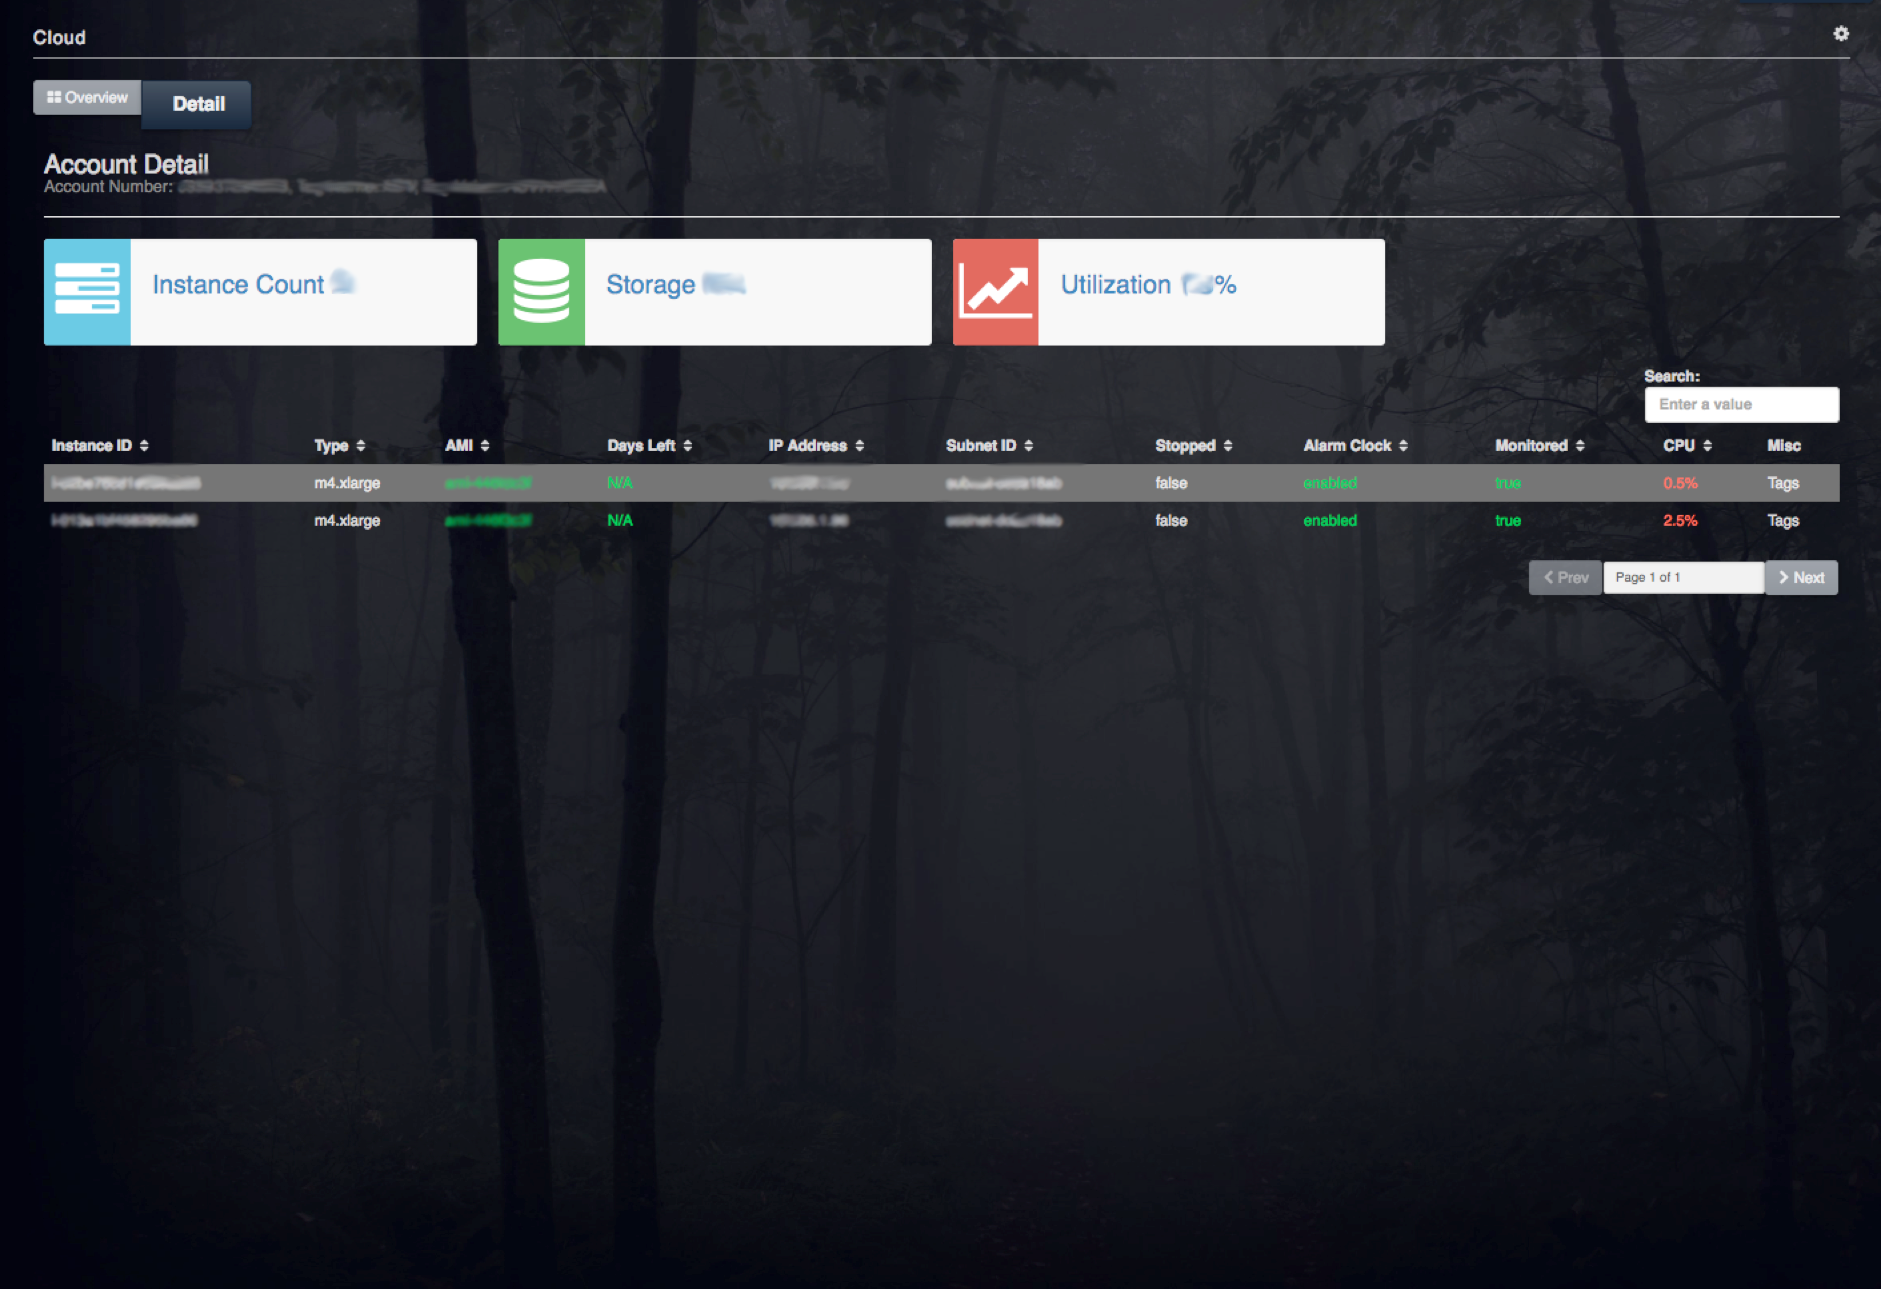
This view displays the instance count, storage, and utilization details for the given account number, Tag Name, and Tag Value combination.
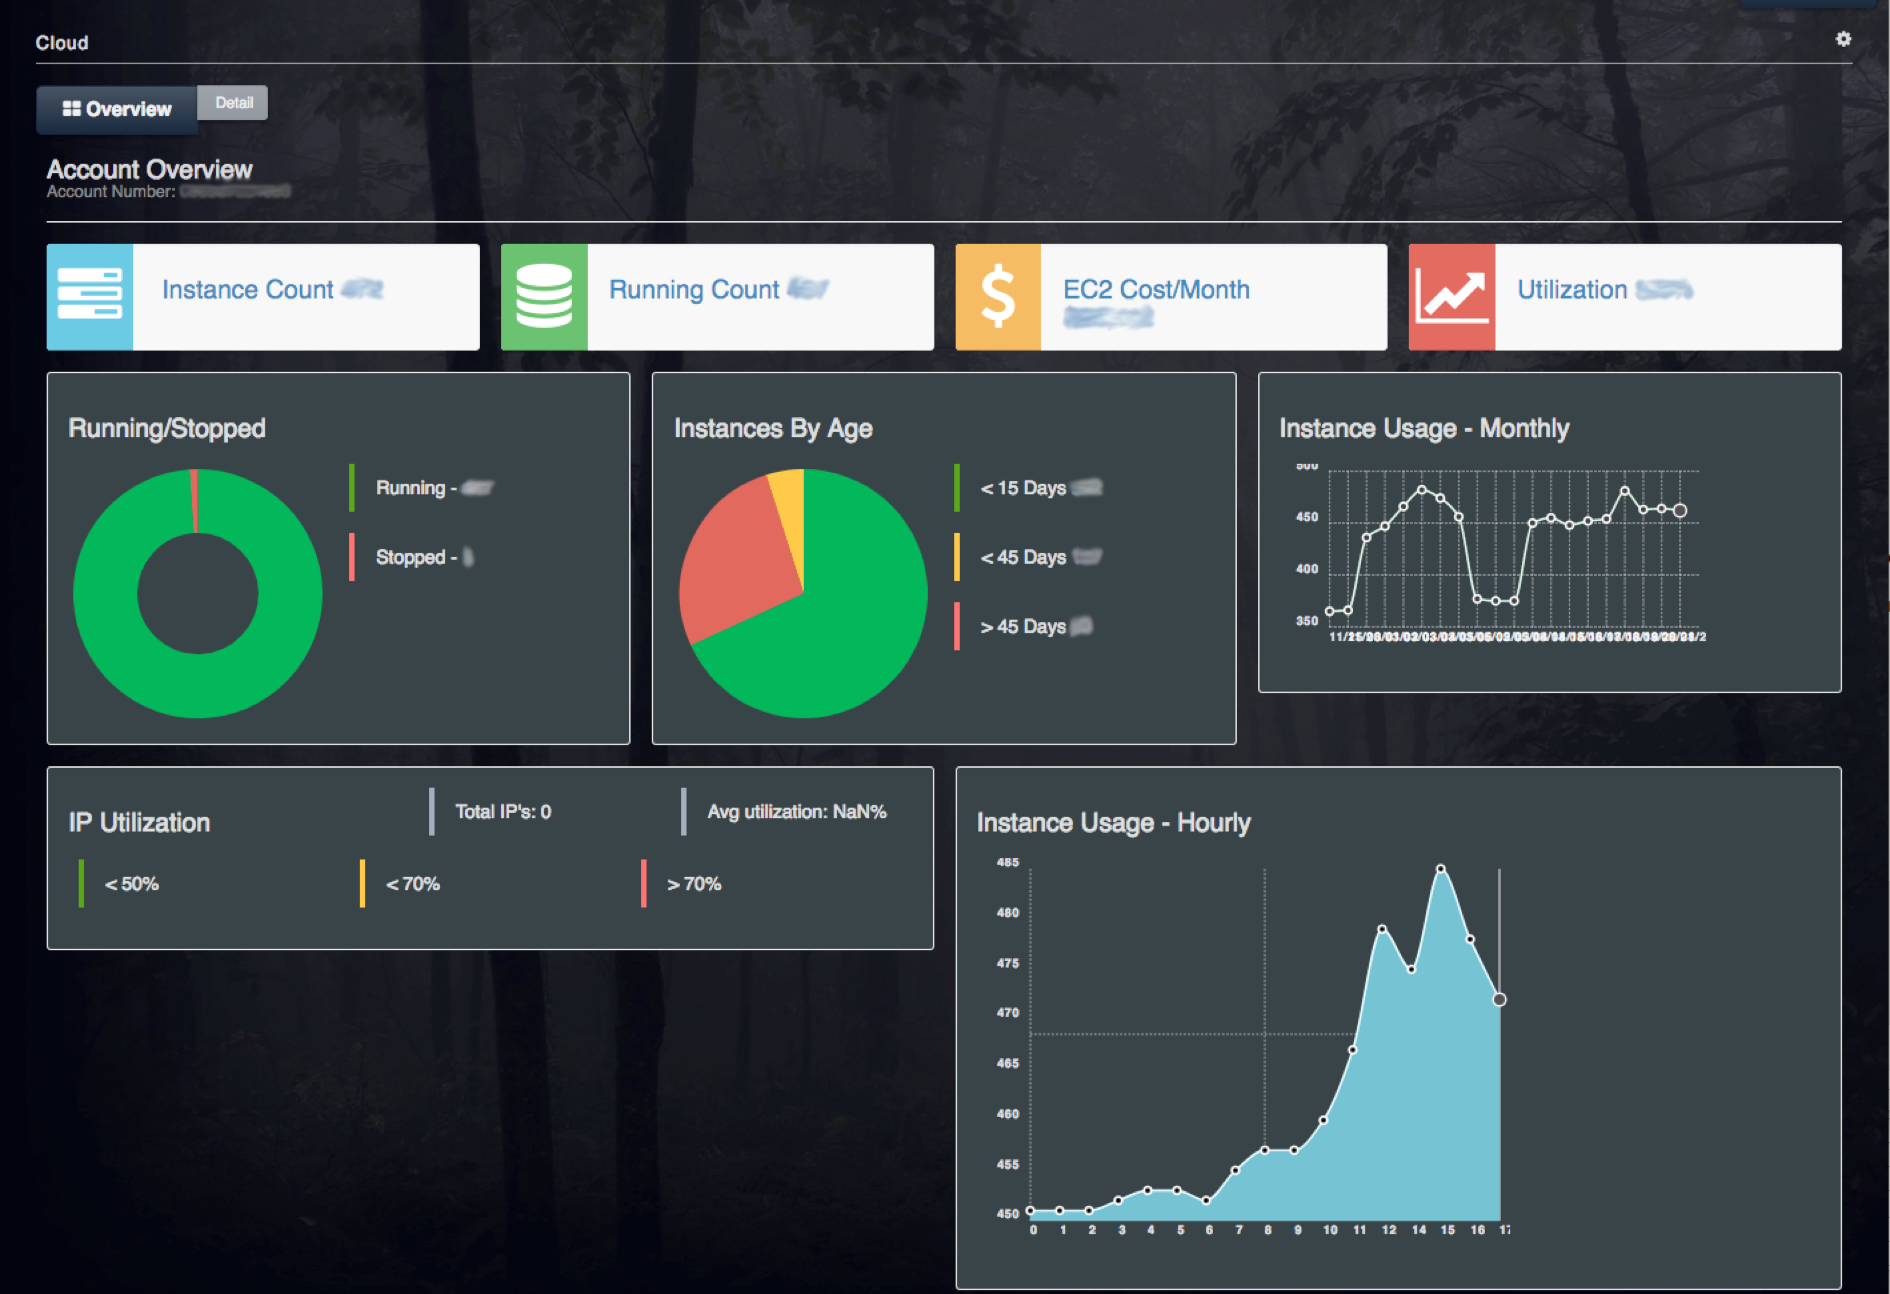
For an account number, you will find the Account Overview for metrics listed as follows:
- Instance Count
- Running Count
- EC2 Cost (per month)
- Utilization
Additional information about cloud utilization that is represented in pie-charts or graphs on the screen, is described as follows:
- Instances that are either running or stopped
- Age of Instances (color-coded according to their state of health)
- <15 days (green)
- <45 days (yellow)
-
45 days (red)
- Two Instance Usage Graphs (Monthly and Hourly)
- IP Utilization (color-coded according to the percentage of utilization)
- <50% (green)
- <70% (yellow)
-
70% (red)
Overview
This view gives a graphical representation for the given account number.
Screenshots:
Cloud - Overview:

Cloud - Detail View:
