Prerequisites:
Before creating a product dashboard, ensure that the following prerequisites are met:
- A Team Dashboard is created
- Build and Code Repo widgets are configured on the team dashboard
The process to create a Team Dashboard and configure the widgets is explained in the following sections.
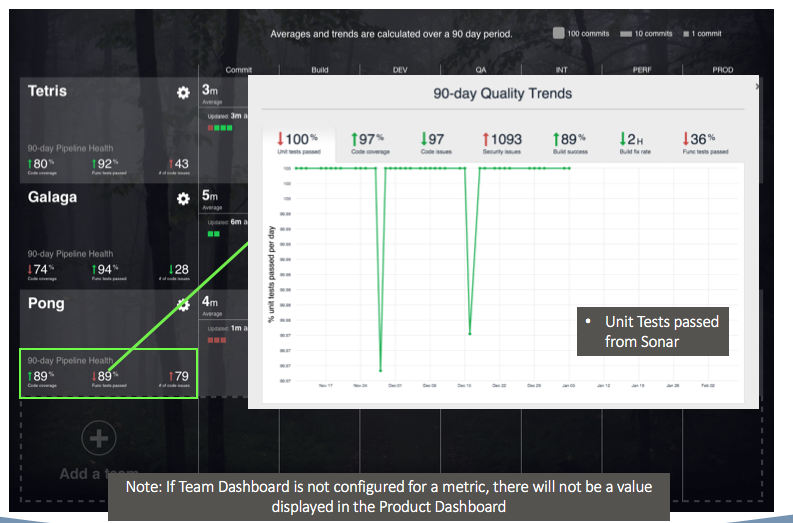
Note: The metrics displayed on the product dashboard are based on the configurations in the team dashboard. If the team dashboard is not configured for a metric, it is not displayed on the product dashboard.
Create a Team Dashboard
To create a team dashboard:
- In the Team Dashboards tab, click Create a new dashboard. This invokes the Create a New Dashboard screen.
- Enter the following details:
- Select the dashboard type as Team Dashboard from the dropdown list.
- Choose Select Widgets radio button to customize the dashboard layout while creating a new dashboard.
-
Choose Select Template radio button to select a dashboard template from the dropdown list. For the team dashboard, select one of the following options:
- Cap One
- Cap One ChatOps
- Cloud Dashboard
- Split View
- Any custom template created by the dashboard administrator
- Enter the dashboard title. The title should have a minimum of 6 characters and should not contain any special characters (for example, !, #, &, _).
- Enter a business service name. This is an optional value.
- Enter a Business Application Type to support the business function. This is an optional value.
-
Enable Score – Check this box to indicate that you want to enable the scoring feature for an existing team dashboard.
Select one of the following radio-buttons to choose how the score appears on the dashboard:
-
Display in Header – Choose this option to display the overall dashboard score at the top of the team dashboard. Click on the star rating to view the score details.
-
Display in Widget – Choose this option to display the overall score as a widget on the dashboard. Click View Details on the widget to see the score details.
For additional details on this feature, see the Keeping Score for Team Dashboards documentation.
-
- Click Create.
Configure Widgets in the Team Dashboard
Once you have created the team dashboard, you can configure the widgets that you want to view on your dashboard. To add the team dashboard to the product dashboard, it is mandatory to configure the Code Repo and Build widget.
Configure the Code Repo Widget
- Click Configure widget to invoke the Configure Repo Widget screen. In this screen, enter the following details:
- Select the Repo Type from the dropdown list:
- GitHub
- Subversion
- Bitbucket
- Gitlab
- Enter the Repo URL for the selected Repo Type
- Enter the Branch for the repo. The repo branch is not applicable for Subversion.
- Enter the repo login Credentials. This is not applicable for Gitlab.
- Enter the API Key for a private Gitlab repo.
- Enter the Personal Access Token for a GitHub repo. For details on generating a Personal Access Token for GitHub, see the GitHub documentation.
- Select the Repo Type from the dropdown list:
- Click Save. The Code Repo widget is configured for the selected repo.
This widget displays code contribution data as follows:
- A graphical representation of the number of issues, pulls, and commits per day versus time intervals (i.e., starting with the current day and going back the previous 14 days)
- A summary of all the commits, pulls, and issues. This area also shows how many commitors, contributors, and ideators are involved. Moreover, for all six of these categories they align with the days last worked on, beginning with today and going back the previous 14 days.
Configure Build Widget
The Jenkins collector displays build-related details in the build widget. To configure the build widget:
- Click Configure widget to invoke the Configure Build Widget screen. In this screen, enter the following details:
- Enter the Build Job
- Enter the Build Duration Threshold (in minutes). The default duration is 3 minutes.
- Alert Takeover Criteria indicates the number of consecutive build fails. The default number is 5.
- Click Save. The Build Widget is configured for the selected repo.
This widget displays the following build information, beginning with the current day and going back the previous 14 days:
- A graphical representation of the number of builds per day
- A summary of the total number of builds for the application
- A graphical depiction of the average build duration
Create a Product Dashboard
To configure the product dashboard:
To create a product dashboard:
- Click Create a new dashboard. The Create a New Dashboard screen is invoked.
- Enter the following details:
- Select the dashboard type as Product Dashboard from the dropdown list.
- Enter the dashboard title. The title should have a minimum of 6 characters and should not contain any special characters (for example, !, #, &, _).
- Enter the Application Name.
- Enter a business service name. This is an optional value.
- Click Create.
Configure the Product Dashboard
To configure a Product Dashboard:
- In the product dashboard screen, click Add a Team. Enter the following details in the Add team pop-up window:
- Select a team dashboard from the drop-down list. The list displays all team dashboards created in Hygieia.
- Optionally, specify a custom team name, and then click Add this team.
Note: Configure the Build and Code Repository before adding the team to the Product Dashboard.
Information on the Product Dashboard
The product dashboard displays averages and trends calculated over a 90-day period.
- DevOps Maturity Score – Quantitative score that measures the application’s DevOps maturity level.
- 90-day Pipeline Health - This segment displays trends to enable easy access to important DevOps metrics over a 90-day period. The various trends displayed include the number of unit and functional tests passed as well as code coverage per day. These metrics also enable you to measure code and security issues, build success, and time taken to fix builds.
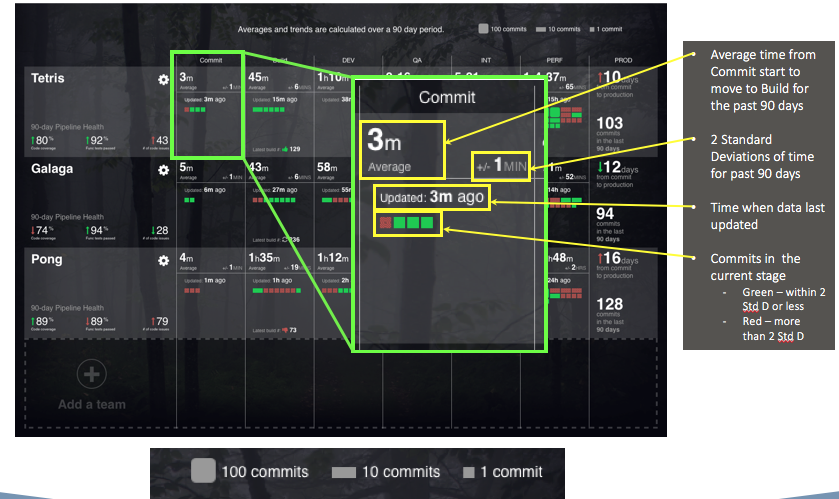
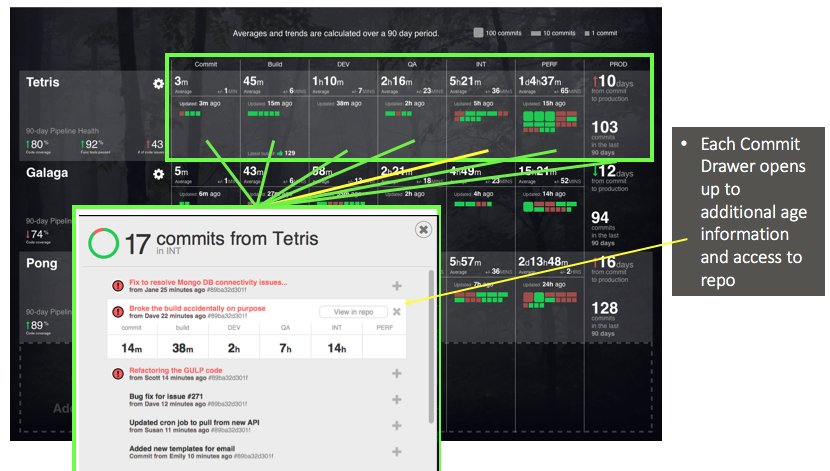
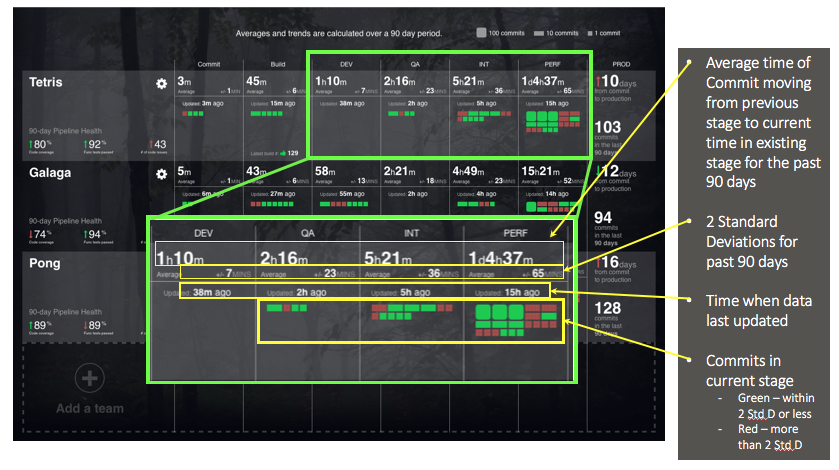
At each of the different development stages, the Product view shows the number of commits waiting to move to the next stage, thus amplifying the wait-times between stages. Thus, the Product View enables teams to reduce the wait-time and speed up the continuous delivery pipeline.
The product dashboard gives in-depth details by highlighting the standard code deviations at each stage:
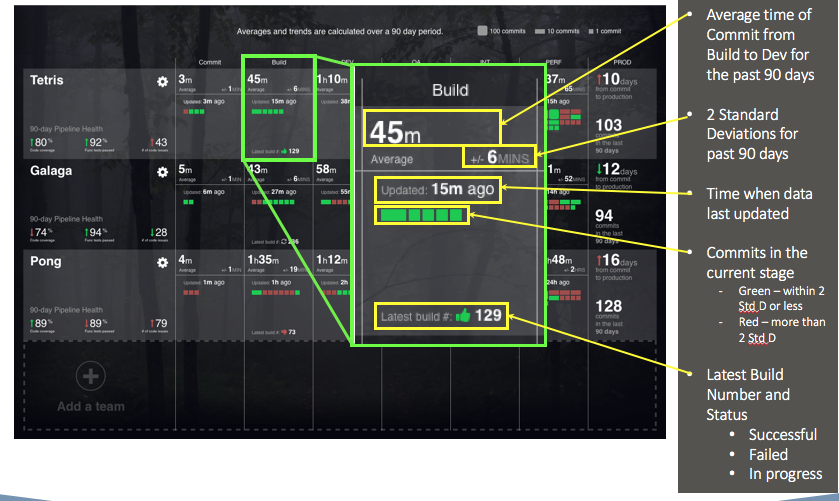
- The green boxes at a development stage indicate the number of commits that do not exceed 2 standard deviations.
- The red boxes indicate that have commits have exceeded over 2 standard deviations.
Screenshots:
The product dashboard displays averages and trends calculated over a 90-day period. For details more details on the calculations displayed on the Product Dashboard, see the following screenshots:
Commit Stage:
Build Stage:
Commit Details at every stage:
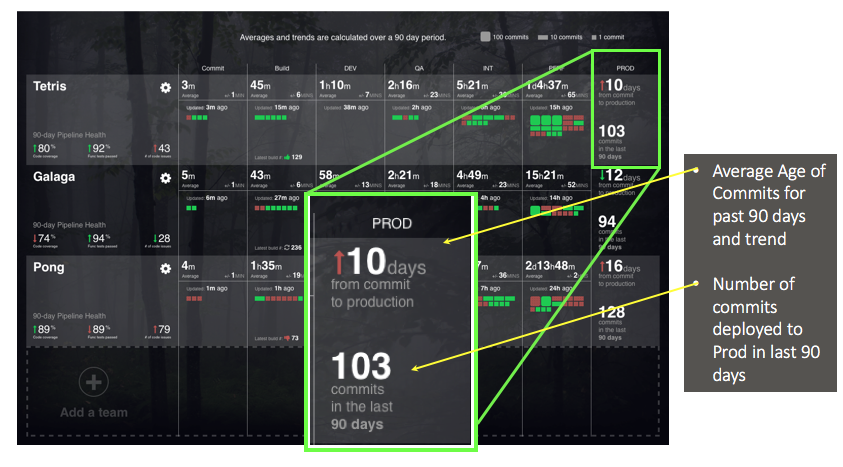
Deployment Stage:
Production Stage:
Pipeline Health Details: